D3.js v4/v5 面グラフ(area chart)の作り方
D3で基本チャートの面グラフの作り方を紹介します。
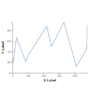
サンプルデモ
サンプルプログラム
|
1 2 3 4 5 6 7 8 9 10 11 12 13 14 15 16 17 18 19 20 21 22 23 24 25 26 27 28 29 30 31 32 33 34 35 36 37 38 39 40 41 42 43 44 45 46 47 48 49 50 51 52 53 54 55 56 57 58 59 60 61 62 63 64 65 66 67 68 69 70 71 72 73 74 75 76 77 78 79 80 81 82 83 84 85 86 87 88 89 90 91 92 93 94 |
<!DOCTYPE html> <html> <head> <meta charset="utf-8"> <title>D3 Area Chart</title> <script src="https://d3js.org/d3.v5.min.js"></script> </head> <body> <script> // 1. データの準備 var dataset = [ [1, 15], [5, 25], [25, 30], [85, 40], [100, 42], [220, 40], [250, 50], [330, 95], [410, 30], [475, 44], [480, 50] ]; var width = 400; // グラフの幅 var height = 300; // グラフの高さ var margin = { "top": 30, "bottom": 60, "right": 30, "left": 60 }; // 2. SVG領域の設定 var svg = d3.select("body").append("svg").attr("width", width).attr("height", height); // 3. 軸スケールの設定 var xScale = d3.scaleLinear() .domain([0, d3.max(dataset, function(d) { return d[0]; })]) .range([margin.left, width - margin.right]); var yScale = d3.scaleLinear() .domain([0, d3.max(dataset, function(d) { return d[1]; })]) .range([height - margin.bottom, margin.top]); // 4. 軸の表示 var axisx = d3.axisBottom(xScale).ticks(5); var axisy = d3.axisLeft(yScale).ticks(5); svg.append("g") .attr("transform", "translate(" + 0 + "," + (height - margin.bottom) + ")") .call(axisx) .append("text") .attr("fill", "black") .attr("x", (width - margin.left - margin.right) / 2 + margin.left) .attr("y", 35) .attr("text-anchor", "middle") .attr("font-size", "10pt") .attr("font-weight", "bold") .text("X Label"); svg.append("g") .attr("transform", "translate(" + margin.left + "," + 0 + ")") .call(axisy) .append("text") .attr("fill", "black") .attr("text-anchor", "middle") .attr("x", -(height - margin.top - margin.bottom) / 2 - margin.top) .attr("y", -35) .attr("transform", "rotate(-90)") .attr("font-weight", "bold") .attr("font-size", "10pt") .text("Y Label"); // 5. エリアの表示 svg.append("path") .datum(dataset) .attr("fill", "rgba(70, 130, 180, 0.3)") .attr("d", d3.area() .x(function(d) { return xScale(d[0]); }) .y1(function(d) { return yScale(d[1]); }) .y0(yScale(0)) ); svg.append("path") .datum(dataset) .attr("fill", "none") .attr("stroke", "steelblue") .attr("stroke-width", 1.5) .attr("d", d3.line() .x(function(d) { return xScale(d[0]); }) .y(function(d) { return yScale(d[1]); }) ); </script> </body> </html> |
解説
こちらに散布図を対象にグラフの作り方のチュートリアルを、こちらに折れ線グラフの作り方をあげています。面グラフは折れ線グラフから少しの変更で作成することができます。
1. データの準備
マージンを設定するために、オブジェクトを用意します。
|
1 |
var margin = { "top": 30, "bottom": 60, "right": 30, "left": 60 }; |
軸を表示するため、下側と左側のマージンを大きめに設定しています。
2. SVG領域の設定
SVGの表示領域を設定します。
3. 軸スケールの設定
軸スケールを設定します。
|
1 |
d3.scaleLinear() |
はdomainで設定したレンジをrangeで設定したレンジに変換する関数を設定します。折れ線グラフの座標を画面上のピクセル値に変換する関数を作成します。
4. 軸の表示
D3の関数d3.axisBottom()とd3.axisLeft()を使って軸要素を設定します。引数を軸スケールの設定で設定した関数とし、callで呼び出すことでSVG要素が自動的に追加されます。
|
1 2 3 4 5 6 7 8 9 10 |
var axisx = d3.axisBottom(xScale).ticks(5); var axisy = d3.axisLeft(yScale).ticks(5); svg.append("g") .attr("transform", "translate(" + 0 + "," + (height - margin.bottom) + ")") .call(axisx) svg.append("g") .attr("transform", "translate(" + margin.left + "," + 0 + ")") .call(axisy) |
.ticks()は軸メモリの数を制御するメソッドです。整数で設定します。
軸を呼び出した後、text要素で軸のラベルを追加します。
|
1 2 3 4 5 6 7 8 9 10 11 12 13 14 15 16 17 18 |
.append("text") .attr("fill", "black") .attr("x", (width - margin.left - margin.right) / 2 + margin.left) .attr("y", 35) .attr("text-anchor", "middle") .attr("font-size", "10pt") .attr("font-weight", "bold") .text("X Label"); .append("text") .attr("fill", "black") .attr("x", -(height - margin.top - margin.bottom) / 2 - margin.top) .attr("y", -35) .attr("transform", "rotate(-90)") .attr("text-anchor", "middle") .attr("font-weight", "bold") .attr("font-size", "10pt") .text("Y Label"); |
“text-anchor”はテキストの位置揃えをするための属性で、”middle”で中央揃えを設定しています。軸に重ならないように35px移動しています。
5. 面エリアの表示
面グラフを”path”要素で表示します。ここが折れ線グラフと異なる部分です。
|
1 2 3 4 5 6 7 8 9 10 11 12 13 14 15 16 17 18 |
svg.append("path") .datum(dataset) .attr("fill", "rgba(70, 130, 180, 0.3)") .attr("d", d3.area() .x(function(d) { return xScale(d[0]); }) .y1(function(d) { return yScale(d[1]); }) .y0(yScale(0)) ); svg.append("path") .datum(dataset) .attr("fill", "none") .attr("stroke", "steelblue") .attr("stroke-width", 1.5) .attr("d", d3.line() .x(function(d) { return xScale(d[0]); }) .y(function(d) { return yScale(d[1]); }) ); |
データバインド時に
|
1 |
.datum(dataset) |
を用いています。ひとつづつのデータをバインドするdataと異なり、”path”にデータセットを丸ごと追加します。また、色の指定時に”rgba(70, 130, 180, 0.3)”を用いています。R、G、B値を0~255で、α値(透明度)を0~1.0で設定します。”opacity”属性でも透明度を設定できますが、”fill”属性と”storke”属性の透明度を別々に変えたいときにrgbaを使います。今回は”storke”属性を設定していませんので、どちらでも構いません。
面エリアの描画時にpathの”d”属性を次のD3のメソッドを用いて設定します。
|
1 2 3 4 |
d3.area() .x(function(d) { return xScale(d[0]); }) .y1(function(d) { return yScale(d[1]); }) .y0(yScale(0)) |
.x()にx座標を指定する関数を、y0に下側(今回はy=0)のy座標を、y1に上側のy座標を設定します。
二つ目の”path”は折れ線グラフと同様に、境界の線を設定するものです。不要の場合は除外してください。
|
1 2 3 |
d3.line() .x(function(d) { return xScale(d[0]); }) .y(function(d) { return yScale(d[1]); }) |
は境界用の”path”の”d”属性を作成するメソッドです。


